Product
Based on our strategy library, we have developed various types of products aimed at providing flexible and professional quantitative trading solutions for all types of investors. Whether you are a newcomer to the cryptocurrency field or an experienced trader, our products can meet your needs. Each product type is designed for different trading cycles and market characteristics, covering various mainstream trading assets (such as ETH, BTC, XRP, etc.), providing you with diverse options.
All QuantCoin products follow a strict testing and release process to ensure the stability, reliability, and profitability of the products:
- Product writing (designing trading strategies)
- Testing (evaluating performance over years of data, testing under extreme market conditions, assessing drawdown and volatility)
- Real trading test (simulating performance in a real environment, validating stability with a small amount of capital, real-time monitoring of strategy performance)
- Stable operation in real trading (observing performance over multiple cycles, accumulating real trading data, improving risk control to ensure stability)
- Customer-facing (officially open to customers, monitoring and optimizing to ensure profits)
QuantCoin Product Types
1. Day Trading Products 🕒
- Characteristics: Focus on short-term market fluctuations, with holding periods typically ranging from a few hours to a day.
- Advantages: Captures short-term market opportunities through high-frequency trading, suitable for investors sensitive to market fluctuations.
- Applicable Assets: Highly liquid cryptocurrencies such as ETH, BTC, XRP.
- Target Audience: Investors who want to quickly obtain returns and can monitor the market in real-time.
2. Daytime Trading Products 🌞
- Characteristics: Holding periods typically range from 2 to 3 days, balancing short-term fluctuations and medium to long-term trends.
- Advantages: Captures more significant market trends while reducing trading frequency, suitable for conservative investors.
- Applicable Assets: Mainstream coins such as ETH, BTC, SOL.
- Target Audience: Investors who want to balance returns and risk control.
3. Medium-term Trading Products 📅
- Characteristics: Holding periods typically range from 1 week to 1 month, focusing on medium-term market trends.
- Advantages: Avoids short-term market noise through medium to long-term holdings, capturing more stable returns.
- Applicable Assets: Cryptocurrencies with medium to long-term potential such as BTC, ETH, SOL.
- Target Audience: Investors who want stable returns without frequent operations.
4. Long-term Trading Products 🗓️
- Characteristics: Holding periods typically exceed 1 month, focusing on long-term market trends.
- Advantages: Maximizes returns from bull markets or structural trends through long-term holdings.
- Applicable Assets: Cryptocurrencies with long-term value such as BTC, ETH, DOT.
- Target Audience: Investors who have long-term confidence in the market and seek high returns.
5. Cross-Asset Arbitrage Products 🔄
- Characteristics: Profits are achieved by capturing price differences between different cryptocurrencies.
- Advantages: Low risk, stable returns, suitable for investors looking for certainty in volatile markets.
- Applicable Assets: Highly correlated trading pairs such as ETH/BTC, XRP/BTC.
- Target Audience: Investors seeking low risk and stable returns.
Product Details
Product Status
Product status has three states: Testing, Running, Redeemed
- Testing: The product is still in the internal testing phase and is not open for user participation.
- Running: The product testing is complete and is open for user participation.
- Redeemed: The product participation scale has reached its limit and no longer accepts user participation.
Lock Period
To ensure the stability of the strategy, prevent frequent redemptions, avoid the impact of fund flow on strategy execution, and protect the long-term interests of investors, QuantCoin products are set with a 3-day lock period. During the lock period, users cannot redeem.
Current Stage
Products will be raised in stages to ensure orderly participation by users and optimize product management. You can view relevant information in the participation progress on the product details page, for example, XRP-MEDIUM-2. Product stages have three states: Testing, Available for Participation, Full.
- Testing Stage: Not open, users cannot participate.
- Available for Participation Stage: Investment is open, users can participate.
- Full Stage: The current stage's participation quota is full, and users must wait for the next stage.
Automatic Redemption Period
To improve capital utilization efficiency, meet users' needs for flexible adjustment of investment strategies, and effectively respond to uncertainties brought by market fluctuations, QuantCoin has introduced an automatic redemption mechanism for all products. This mechanism aims to provide users with a more efficient and convenient capital management experience while reducing investment risks.
The automatic redemption mechanism means that on the preset redemption date of the product (you can check this on the product details page, for example, XRP-MEDIUM-2), the system will automatically redeem the user's product shares and corresponding earnings back to the user's QuantCoin account. The entire process does not require manual operation by the user and is fully automated, ensuring that funds are quickly credited.
The automatic redemption date for each product varies based on its strategy type and holding period. The following table details the strategy descriptions, holding periods, automatic redemption periods, and characteristics of each product series, helping you better understand and estimate the product's redemption date.
| Product Type | Strategy Description | Holding Period | Automatic Redemption Period | Characteristics |
|---|---|---|---|---|
| DAY Series | Day Trading Strategy | ≤ 1 day | 3 days | Suitable for short-term traders, capturing daily volatility profits |
| SHORT Series | Daytime Trading Strategy | 2-3 days | 7 days | Suitable for medium-short term traders, capturing 2-3 days market fluctuations |
| MEDIUM Series | Medium-term Trading Strategy | > 1 week | 15 days | Suitable for medium-long term traders, combining trend following and mean reversion strategies |
| LONG Series | Trend Following Strategy | > 2 weeks | 30 days | Suitable for long-term investors, capturing major trend movements |
| Cross-Asset Arbitrage Series | Cross-Asset Arbitrage Strategy | Variable | 7-30 days | Arbitrage profits based on differences in volatility between different assets |
Note
- During the lock period, users cannot redeem.
- After the lock period, but before the automatic redemption date, users can choose whether to redeem early. If the product is still in a loss state, QuantCoin will not be responsible for compensating the product loss after early redemption.
- Upon reaching the automatic redemption date, the program will automatically redeem; if there is a product loss, QuantCoin will be responsible for compensating the user's loss. :::
Product Stages
On the QuantCoin product details page, you will see participation information similar to the following:
Stage Participation 26: $9,300/$18,000
This set of numbers indicates the real-time participation status of the current product at this stage, with the specific meanings as follows:
- $9,300: Indicates the total amount that has been subscribed by users at this stage.
- $18,000: Indicates the total fundraising target amount set for this stage.
- 26: Indicates that this is the 26th participation stage of the product.
Stage Mechanism: QuantCoin products adopt a phased fundraising model, with each stage having independent quota limits.
Product-Related Charts
Net Value Chart
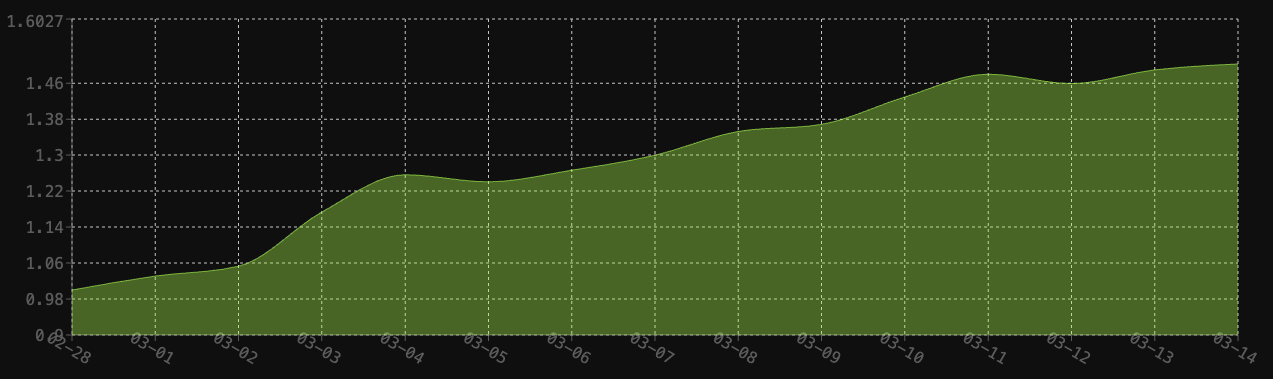
Horizontal Axis: Time, Vertical Axis: Net Value
Net Value = (Total Fund Assets - Total Liabilities) / Total Shares
Core Significance of Net Value
- Profit Measurement: Net value growth = product investment profit, for example, from February 28 to March 14, the net value increased from 1.0 to 1.48, indicating a profit of 48%.
- Risk Indicator: The fluctuation range of net value reflects the market risk level.
- Trading Benchmark: Both subscription/redemption are based on the net value of the day.
TIP
The net value chart shows the net value of the product at each point in time; the higher the net value, the better the product's performance.
Daily Return Rate Chart
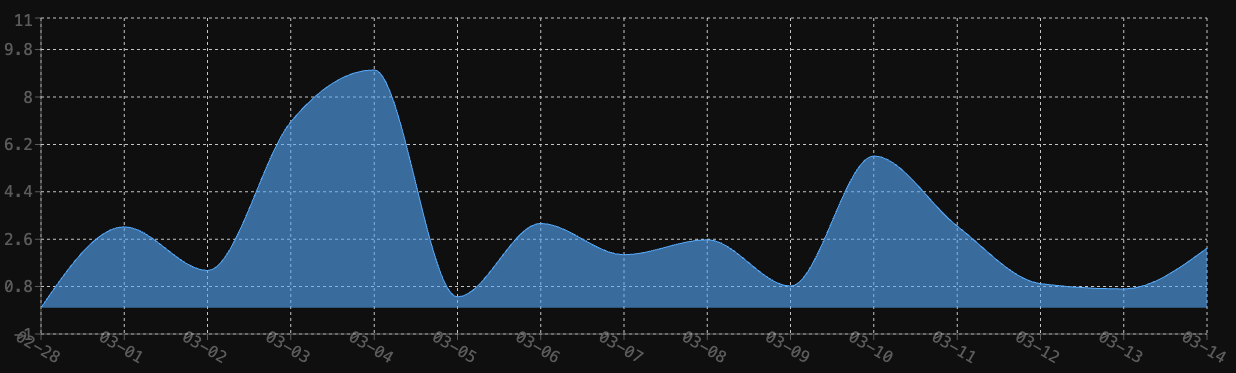
Horizontal Axis: Time, Vertical Axis: Return Rate
Return Rate = (Current Value - Initial Investment) / Initial Investment × 100%
- The return rate directly shows whether today's investment has made a profit or a loss. It indicates the percentage of profit or loss relative to the initial investment.
- The return rate varies daily, reflecting market fluctuations.
- As shown in the chart, the day with the highest return rate was March 4, reaching 9.03%, while the lowest day was February 28.
Daily Transaction Record Table
| Date | Stage | Amount | Share |
|---|---|---|---|
| 2025-03-14 | 15 | $18000 | 0.6617 |
| 2025-03-13 | 14 | $8700 | 0.6767 |
| 2025-03-12 | 13 | $16500 | 0.6815 |
Data Overview 📈
This table displays the deposit records of the product on the decentralized exchange (DEX). Each row represents a specific date's deposit operation, including amount, stage, and share ratio.
Key Field Descriptions 🔑
- Date: The specific date when the deposit operation occurred.
- Stage: The current stage of the product. Each stage will open until all shares of that stage are fully claimed.
- Amount: The amount deposited, in USDT.
- Share: The share ratio of the product at this stage.
Example Explanation 🛠️
For the data on 2025-03-14:
- Date: 2025-03-14
- Stage: 15
- Amount: $18000.326643
- Share: 0.6655
This indicates that in the 15th stage, the product deposited $18000.326643 into the exchange, with a share ratio of 0.6655.
Product Market Chart
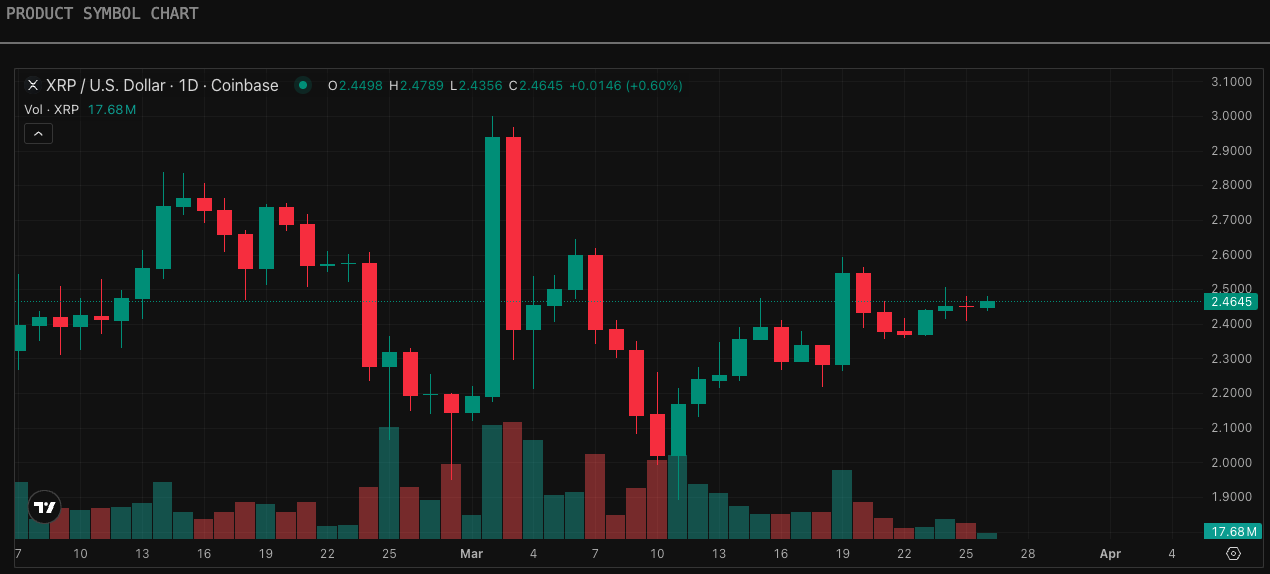
For example, the real-time market chart of the XPR-USDT cryptocurrency trading pair, which fully presents the price fluctuations and technical indicator changes of this trading asset in the recent market.
Historical Return Query Function for Products
Through the simulated return function, users can simulate the potential returns of the product based on its historical data before investing.
Users can find the cumulative return button in the product list page or in the daily return section of the product details page.
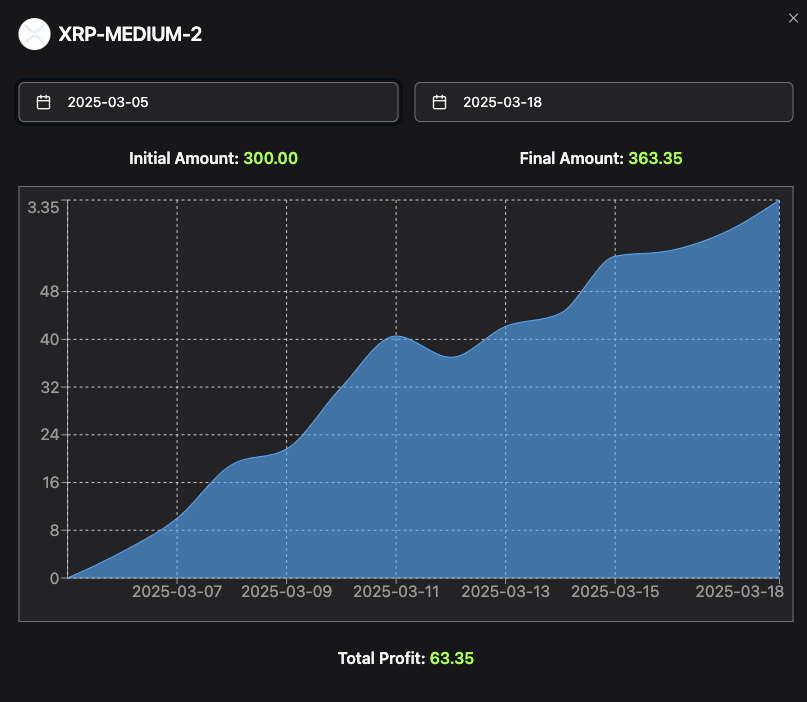
- Initial Amount: Represents the initial amount.
- Final Amount: Represents the final amount (principal + returns).
- Total Profit: Represents the total returns brought by the product within the selected date.
You can click the date button to simulate the product's returns over different time periods, providing intuitive investment references to assist in decision-making.